Measure and track delivery performance
This guide demonstrates how to set up a comprehensive delivery performance monitoring solution across engineering teams. You will learn how to measure key engineering metrics that answer the question: How fast and consistently do we deliver?
Common use cases
- Track PR cycle time to identify bottlenecks in reviews and CI processes.
- Monitor PR throughput to understand delivery flow and detect platform issues.
- Measure deployment frequency to see how often customer value is shipped.
- Identify overdue PRs to surface workflow inefficiencies and blocked work.
Prerequisites
This guide assumes the following:
- You have a Port account and have completed the onboarding process.
- Port's GitHub integration is installed in your account.
Key metrics overview
We will track four key metrics to measure delivery performance:
- PR cycle time - Exposes friction in reviews, CI wait times, and other bottlenecks.
- PR throughput - Shows delivery flow and whether CI or platform issues block output.
- Deployment frequency - Shows how often customer value is shipped.
- Overdue PRs (open > 3 days) - Signals workflow inefficiencies, unclear ownership, or blocked work.
Set up data model
We will create several blueprints to model your GitHub data. The service blueprint should already exist from onboarding.
Create the GitHub user blueprint
-
Go to the Builder page of your portal.
-
Click on
+ Blueprint. -
Click on the
{...}button in the top right corner, and chooseEdit JSON. -
Add this JSON schema:
GitHub user blueprint (Click to expand)
{
  "identifier": "githubUser",
  "title": "Github User",
  "icon": "Github",
  "schema": {
    "properties": {
      "email": {
        "title": "Email",
        "type": "string"
      }
    },
    "required": []
  },
  "mirrorProperties": {},
  "calculationProperties": {},
  "aggregationProperties": {},
  "relations": {}
} -
Click
Saveto create the blueprint.
Create the GitHub repository blueprint
-
Go to your Builder page.
-
Click on
+ Blueprint. -
Click on the
{...}button in the top right corner, and chooseEdit JSON. -
Add this JSON schema:
GitHub repository blueprint (Click to expand)
{
  "identifier": "githubRepository",
  "title": "Repository",
  "icon": "Github",
  "ownership": {
    "type": "Direct"
  },
  "schema": {
    "properties": {
      "readme": {
        "title": "README",
        "type": "string",
        "format": "markdown"
      },
      "url": {
        "icon": "DefaultProperty",
        "title": "Repository URL",
        "type": "string",
        "format": "url"
      },
      "defaultBranch": {
        "title": "Default branch",
        "type": "string"
      },
      "last_push": {
        "icon": "GitPullRequest",
        "title": "Last push",
        "description": "Last commit to the main branch",
        "type": "string",
        "format": "date-time"
      }
    },
    "required": []
  },
  "mirrorProperties": {},
  "calculationProperties": {},
  "aggregationProperties": {},
  "relations": {
    "service": {
      "title": "Service",
      "target": "service",
      "required": false,
      "many": false
    }
  }
} -
Click
Saveto create the blueprint.
Create or update the GitHub pull request blueprint
If you already have a pull request blueprint, you need to add the following properties to it. Otherwise, create a new one.
-
Go to your Builder page.
-
If you have an existing pull request blueprint, hover over it, click on the
...button, and selectEdit JSON. Otherwise, click on+ Blueprintand thenEdit JSON. -
Add or update the JSON schema:
GitHub pull request blueprint (Click to expand)
{
  "identifier": "githubPullRequest",
  "title": "Pull Request",
  "icon": "Github",
  "schema": {
    "properties": {
      "status": {
        "title": "Status",
        "type": "string",
        "enum": [
          "merged",
          "open",
          "closed"
        ],
        "enumColors": {
          "merged": "purple",
          "open": "green",
          "closed": "red"
        }
      },
      "closedAt": {
        "title": "Closed at",
        "type": "string",
        "format": "date-time"
      },
      "updatedAt": {
        "title": "Updated at",
        "type": "string",
        "format": "date-time"
      },
      "mergedAt": {
        "title": "Merged at",
        "type": "string",
        "format": "date-time"
      },
      "createdAt": {
        "title": "Created at",
        "type": "string",
        "format": "date-time"
      },
      "link": {
        "format": "url",
        "type": "string",
        "title": "Link"
      },
      "leadTimeHours": {
        "type": "number",
        "title": "Lead Time Hours"
      },
      "pr_age": {
        "icon": "DefaultProperty",
        "type": "number",
        "title": "PR Age"
      },
      "cycle_time": {
        "type": "number",
        "title": "Cycle Time"
      },
      "freshness": {
        "icon": "DefaultProperty",
        "type": "string",
        "title": "Freshness"
      }
    },
    "required": []
  },
  "mirrorProperties": {},
  "calculationProperties": {},
  "aggregationProperties": {},
  "relations": {
    "git_hub_assignees": {
      "title": "GitHub Assignees",
      "target": "githubUser",
      "required": false,
      "many": true
    },
    "git_hub_creator": {
      "title": "GitHub Creator",
      "target": "githubUser",
      "required": false,
      "many": false
    },
    "repository": {
      "title": "Repository",
      "target": "githubRepository",
      "required": false,
      "many": false
    },
    "git_hub_reviewers": {
      "title": "GitHub Reviewers",
      "target": "githubUser",
      "required": false,
      "many": true
    }
  }
}
If you're updating an existing pull request blueprint, make sure to add the pr_age, cycle_time, and freshness properties if they don't already exist.
- Click
Saveto create or update the blueprint.
Create the deployment blueprint
-
Go to your Builder page.
-
Click on
+ Blueprint. -
Click on the
{...}button in the top right corner, and chooseEdit JSON. -
Add this JSON schema:
Deployment blueprint (Click to expand)
{
  "identifier": "deployment",
  "title": "Deployment",
  "icon": "Deployment",
  "schema": {
    "properties": {
      "description": {
        "title": "Description",
        "type": "string"
      },
      "ref": {
        "title": "Ref",
        "type": "string"
      },
      "sha": {
        "title": "Sha",
        "type": "string"
      },
      "transientEnvironment": {
        "title": "Transient Running Service",
        "type": "boolean"
      },
      "productionEnvironment": {
        "title": "Production Running Service",
        "type": "boolean"
      },
      "createdAt": {
        "title": "Created At",
        "type": "string",
        "format": "date-time"
      },
      "url": {
        "title": "URL",
        "type": "string",
        "icon": "Link",
        "format": "url"
      }
    },
    "required": []
  },
  "mirrorProperties": {
    "owning_team": {
      "title": "Owning Team",
      "path": "service.$team"
    }
  },
  "calculationProperties": {},
  "aggregationProperties": {},
  "relations": {
    "service": {
      "title": "Service",
      "target": "service",
      "required": false,
      "many": false
    }
  }
} -
Click
Saveto create the blueprint.
Update integration mapping
Now we'll configure the GitHub integration to ingest data into your catalog.
-
Go to your Data Source page.
-
Select the GitHub integration.
-
Add the following YAML block into the editor to ingest data from GitHub:
GitHub integration configuration (Click to expand)
resources:
  - kind: repository
    selector:
      query: 'true'
      teams: true
    port:
      entity:
        mappings:
          identifier: .full_name
          title: .name
          blueprint: '"githubRepository"'
          properties:
            readme: file://README.md
            url: .html_url
            defaultBranch: .default_branch
            last_push: .pushed_at
  - kind: user
    selector:
      query: 'true'
    port:
      entity:
        mappings:
          identifier: .login
          title: .login
          blueprint: '"githubUser"'
  - kind: pull-request
    selector:
      query: 'true'
      closedPullRequests: true
    port:
      entity:
        mappings:
          identifier: .id|tostring
          title: .title
          blueprint: '"githubPullRequest"'
          properties:
            status: .status
            closedAt: .closed_at
            updatedAt: .updated_at
            mergedAt: .merged_at
            createdAt: .created_at
            link: .html_url
            leadTimeHours: >-
              (.created_at as $createdAt | .merged_at as $mergedAt | ($createdAt
              | sub("\\..*Z$"; "Z") | strptime("%Y-%m-%dT%H:%M:%SZ") | mktime)
              as $createdTimestamp | ($mergedAt | if . == null then null else
              sub("\\..*Z$"; "Z") | strptime("%Y-%m-%dT%H:%M:%SZ") | mktime end)
              as $mergedTimestamp | if $mergedTimestamp == null then null else
              (((($mergedTimestamp - $createdTimestamp) / 3600) * 100 | floor) /
              100) end)
            pr_age: >-
              ((now - (.created_at | sub("\\.[0-9]+Z$"; "Z") | fromdateiso8601))
              / 86400) | round
            freshness: >-
              ((now - (.created_at | sub("\\.[0-9]+Z$"; "Z") | fromdateiso8601))
              / 86400 | round) as $age | if $age <= 3 then "0-3 days" elif $age
              <= 7 then "3-7 days" else ">7 days" end
            cycle_time: >-
              if .merged_at then (((.merged_at   | sub("\\.[0-9]+Z$"; "Z") |
              fromdateiso8601) - (.created_at | sub("\\.[0-9]+Z$"; "Z") |
              fromdateiso8601)) / 86400 | round) else null end
          relations:
            repository: .head.repo.full_name
  - kind: pull-request
    selector:
      query: 'true'
    port:
      entity:
        mappings:
          identifier: .id|tostring
          blueprint: '"githubPullRequest"'
          properties: {}
          relations:
            git_hub_assignees: '[.assignees[].login]'
            git_hub_reviewers: '[.requested_reviewers[].login]'
            git_hub_creator: .user.login
  - kind: deployment
    selector:
      query: 'true'
    port:
      entity:
        mappings:
          identifier: .repo + '-' + (.id|tostring)
          title: .task + '-' + .environment
          blueprint: '"deployment"'
          properties:
            description: .description
            ref: .ref
            sha: .sha
            productionEnvironment: .production_environment
            transientEnvironment: .transient_environment
            createdAt: .created_at
            url: .repository_url
          relations:
service: .repo -
Click
Save & Resyncto apply the mapping.
Visualize metrics
Once the GitHub data is synced, we can create a dedicated dashboard in Port to monitor and analyze delivery performance using customizable widgets.
Create a dashboard
- Navigate to your software catalog.
- Click on the
+ Newbutton in the left sidebar. - Select New dashboard.
- Name the dashboard Delivery Performance.
- Click
Create.
We now have a blank dashboard where we can start adding widgets to visualize delivery performance metrics.
Add widgets
In the new dashboard, create the following widgets:
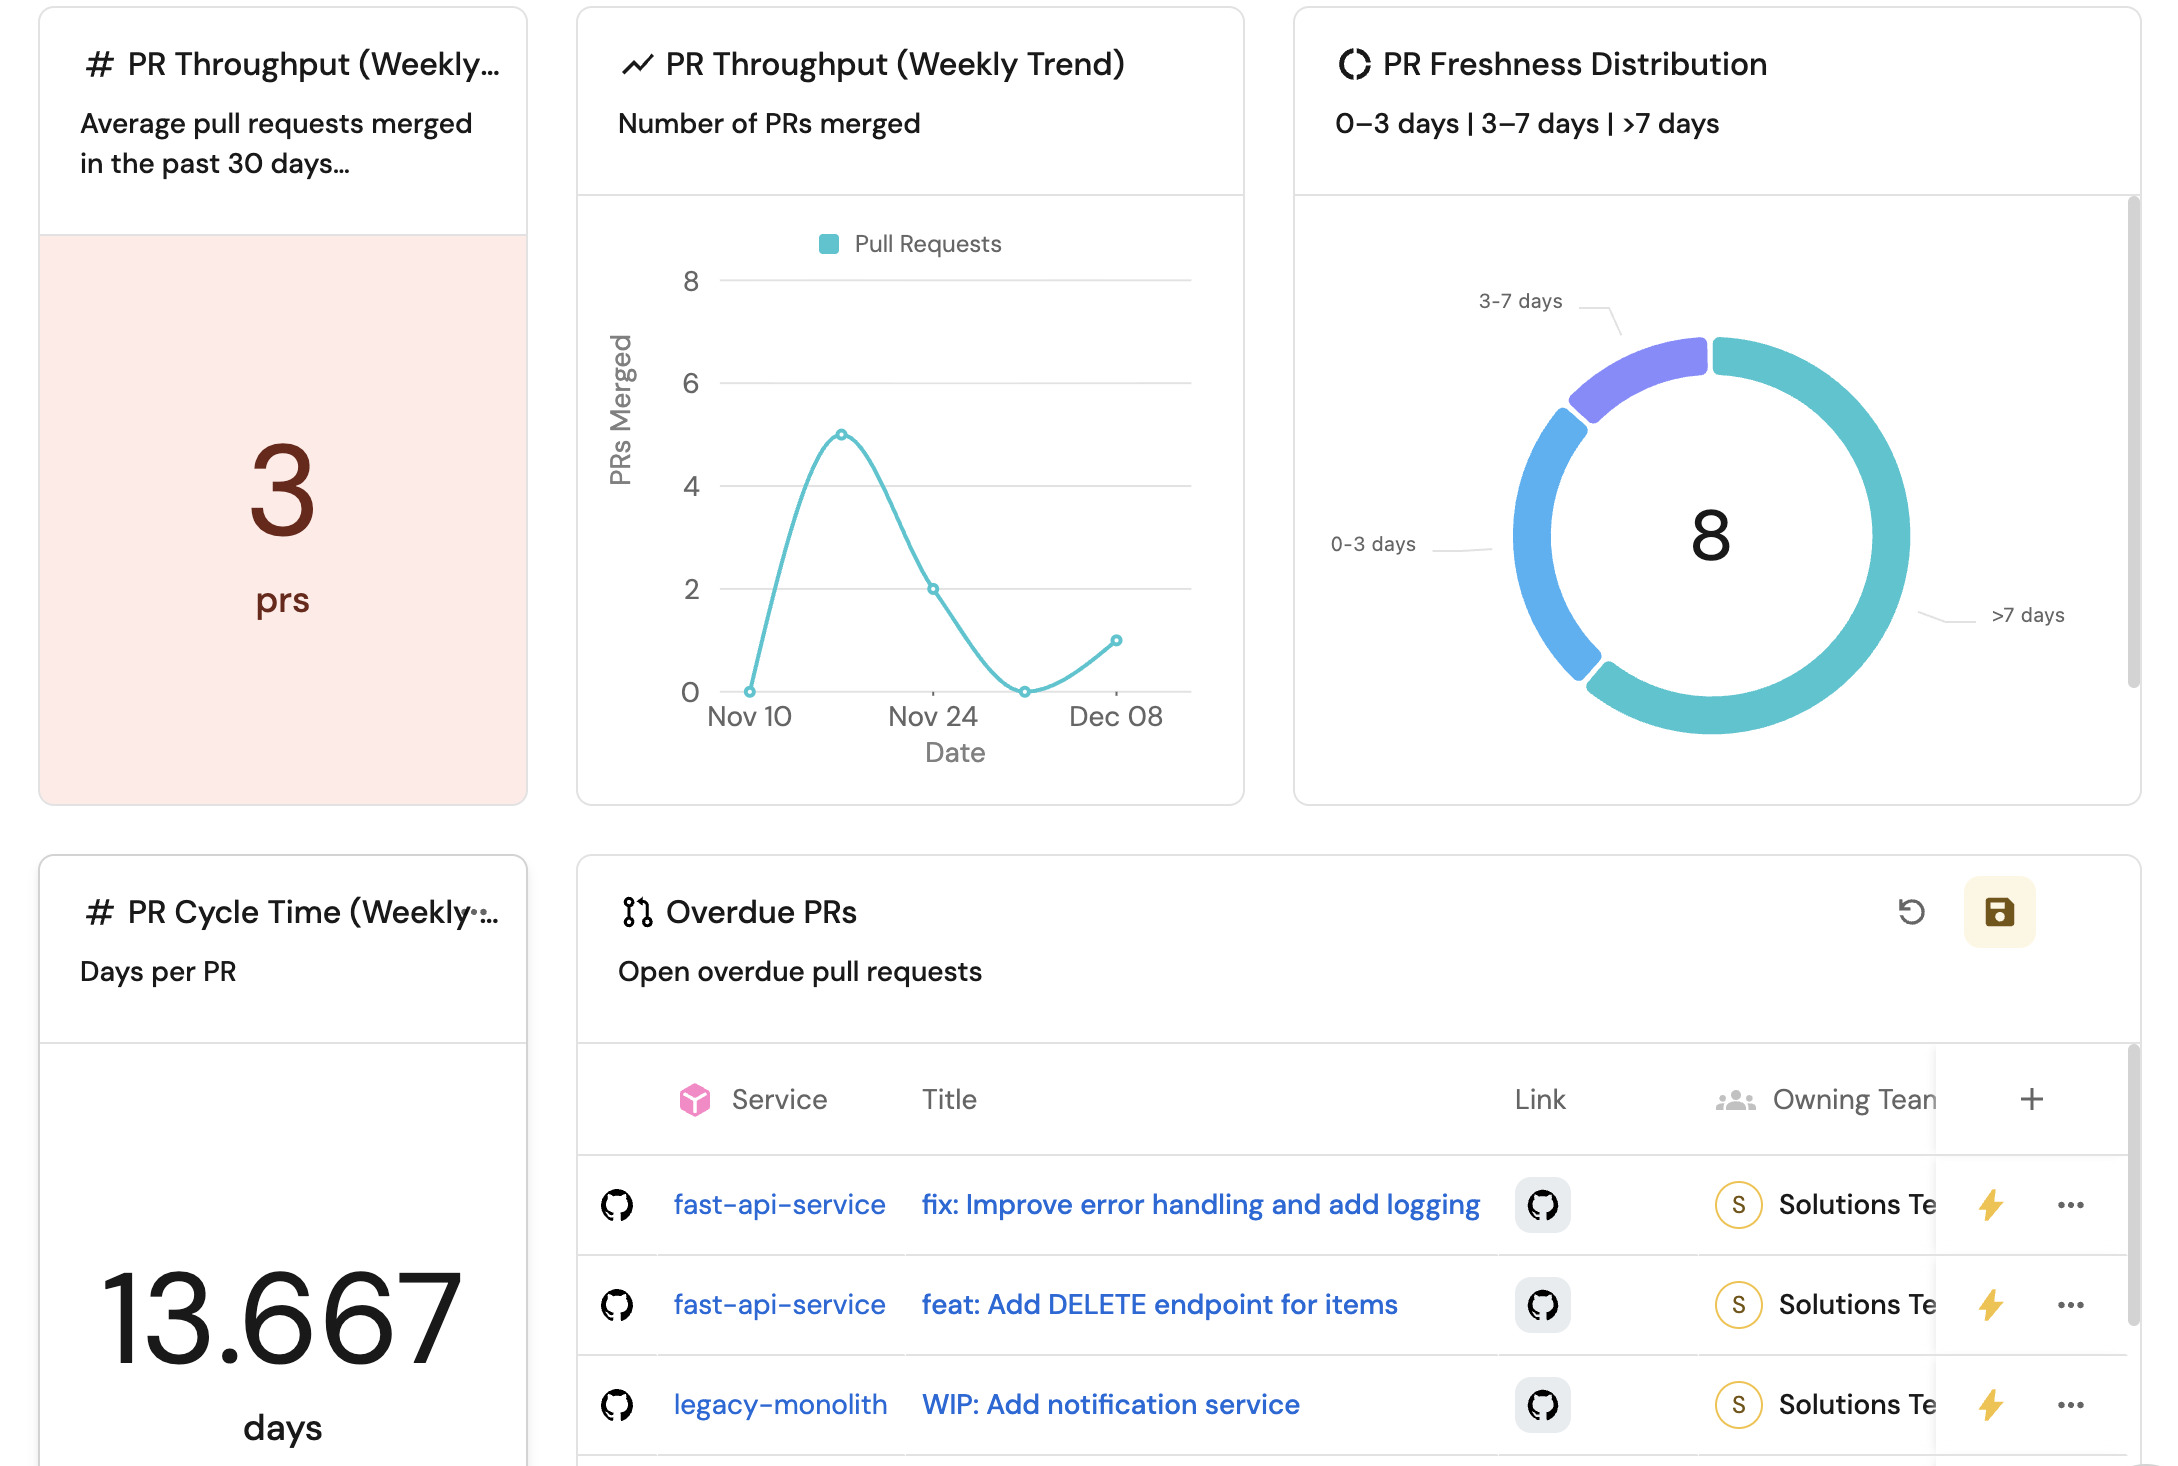
PR throughput (weekly avg) (click to expand)
-
Click
+ Widgetand select Number Chart. -
Title:
PR Throughput (Weekly Avg). -
Description:
Average pull requests merged in the past 30 days. -
Select
Count entitiesChart type and choose Pull Request as the Blueprint. -
Select
averagefor the Function. -
Select
weekfor Average of. -
Select
createdAtfor Measure time by. -
Add this JSON to the Dataset filter editor:
{
  "combinator": "and",
  "rules": [
    {
      "value": "merged",
      "property": "status",
      "operator": "="
    },
    {
      "property": "updatedAt",
      "operator": "between",
      "value": {
        "preset": "lastMonth"
      }
    }
  ]
} -
Select
customas the Unit and inputprsas the Custom unit. -
Click
Save.
PR throughput (weekly trend) (click to expand)
-
Click
+ Widgetand select Line Chart. -
Title:
PR Throughput (Weekly Trend). -
Select
Count Entities (All Entities)Chart type and choose Pull Request as the Blueprint. -
Input
PR mergedas the Y axis Title. -
Select
countfor the Function. -
Add this JSON to the Additional filters editor:
{
  "combinator": "and",
  "rules": [
    {
      "value": "merged",
      "property": "status",
      "operator": "="
    }
  ]
} -
Input
Dateas the X axis Title. -
Select
createdAtfor Measure time by. -
Set Time Interval to
weekand Time Range toIn the past 30 days. -
Click
Save.
PR cycle time (weekly avg) (click to expand)
-
Click
+ Widgetand select Number Chart. -
Title:
PR Cycle Time (Weekly Avg). -
Select
Aggregate Property (All Entities)Chart type and choose Pull Request as the Blueprint. -
Select
cycle_timeas the Property. -
Select
averagefor the Function. -
Select
weekfor Average of. -
Select
createdAtfor Measure time by. -
Add this JSON to the Additional filters editor:
{
  "combinator": "and",
  "rules": [
    {
      "value": "merged",
      "property": "status",
      "operator": "="
    },
    {
      "property": "updatedAt",
      "operator": "between",
      "value": {
        "preset": "lastMonth"
      }
    }
  ]
} -
Select
customas the Unit and inputdaysas the Custom unit. -
Click
Save.
PR cycle time (weekly trend) (click to expand)
-
Click
+ Widgetand select Line Chart. -
Title:
PR Cycle Time (Weekly Trend). -
Select
Aggregate Property (All Entities)Chart type and choose Pull Request as the Blueprint. -
Input
Cycle Time (days)as the Y axis Title. -
Select
cycle_timeas the Property. -
Select
averagefor the Function. -
Input
Dateas the X axis Title. -
Select
createdAtfor Measure time by. -
Set Time Interval to
weekand Time Range toIn the past 30 days. -
Add this JSON to the Additional filters editor:
{
  "combinator": "and",
  "rules": [
    {
      "value": "merged",
      "property": "status",
      "operator": "="
    }
  ]
} -
Click
Save.
Deployment frequency (click to expand)
- Click
+ Widgetand select Number Chart. - Title:
Deployment Frequency. - Select
Count entitiesChart type and choose Deployment as the Blueprint. - Select
countfor the Function. - Select
customas the Unit and inputdeploymentsas the Custom unit. - Click
Save.
Deployment frequency (weekly trend) (click to expand)
- Click
+ Widgetand select Line Chart. - Title:
Deployment Frequency (Weekly Trend). - Select
Count Entities (All Entities)Chart type and choose Deployment as the Blueprint. - Input
Deploymentsas the Y axis Title. - Select
countfor the Function. - Input
Dateas the X axis Title. - Select
createdAtfor Measure time by. - Set Time Interval to
weekand Time Range toIn the past 30 days. - Click
Save.
Overdue PRs (click to expand)
-
Click
+ Widgetand select Number Chart. -
Title:
Overdue PRs. -
Description:
PRs opened longer than 3 days. -
Select
Count entitiesChart type and choose Pull Request as the Blueprint. -
Select
countfor the Function. -
Add this JSON to the Dataset filter editor:
{
  "combinator": "and",
  "rules": [
    {
      "value": "open",
      "property": "status",
      "operator": "="
    },
    {
      "value": 3,
      "property": "pr_age",
      "operator": ">"
    },
    {
      "property": "createdAt",
      "operator": "between",
      "value": {
        "preset": "lastMonth"
      }
    }
  ]
} -
Select
customas the Unit and inputprsas the Custom unit. -
Click
Save.
PR freshness distribution (click to expand)
-
Click
+ Widgetand select Pie chart. -
Title:
PR Freshness Distribution. -
Description:
0–3 days | 3–7 days | >7 days. -
Choose the Pull Request blueprint.
-
Under
Breakdown by property, select the Freshness property. -
Add this JSON to the Additional filters editor:
{
  "combinator": "and",
  "rules": [
    {
      "value": "open",
      "property": "status",
      "operator": "="
    },
    {
      "property": "createdAt",
      "operator": "between",
      "value": {
        "preset": "lastMonth"
      }
    }
  ]
} -
Click Save.
Overdue PRs table (click to expand)
-
Click
+ Widgetand select Table. -
Title the widget Overdue PRs.
-
Choose the Pull Request blueprint.
-
Add this JSON to the Initial filters editor:
{
  "combinator": "and",
  "rules": [
    {
      "value": "open",
      "property": "status",
      "operator": "="
    },
    {
      "value": 3,
      "property": "pr_age",
      "operator": ">"
    },
    {
      "property": "createdAt",
      "operator": "between",
      "value": {
        "preset": "lastMonth"
      }
    }
  ]
} -
Click Save to add the widget to the dashboard.
-
Click on the
...button in the top right corner of the table and select Customize table. -
In the top right corner of the table, click on
Manage Propertiesand add the following properties:- Repository: The name of each related repository.
- Link: The URL to the pull request.
- Title: The title of the pull request.
- Owning Team: The team that owns the service (via repository relation).
- PR Age: The age of the pull request in days.
-
Click on the save icon in the top right corner of the widget to save the customized table.